Turning data visibility into a starting point for investigation.
Bold captures data movement. My high-level map organizes those events into connected routes, helping analysts choose what to investigate before opening individual records.
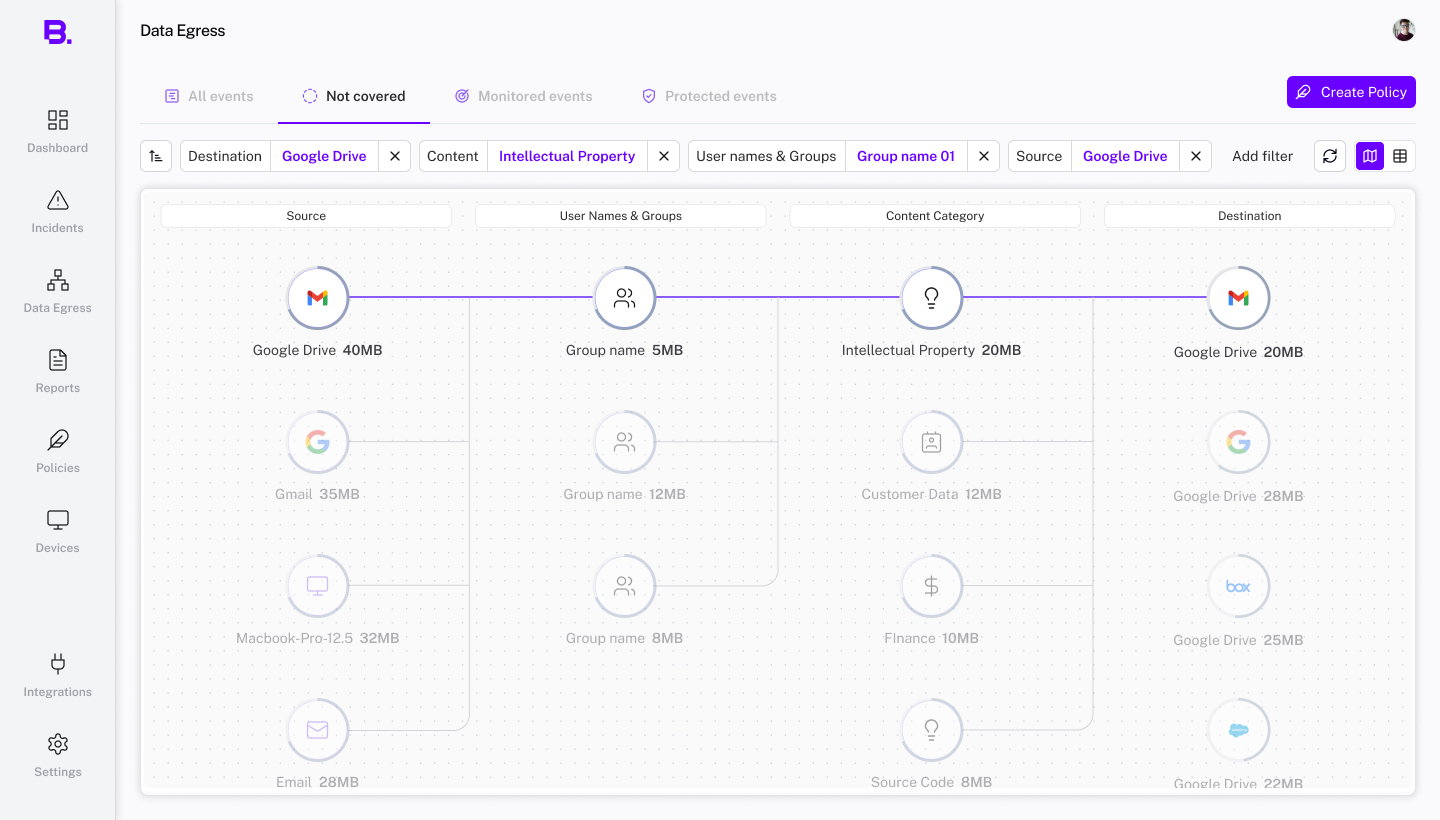
Where is data coming from?
Start with the source.
What sensitive data is moving, and through whom?
Connect the content category with the user group.
Where does it go?
Follow the connection to its destination.
Understand the activity before choosing what to investigate.
Seeing who moves sensitive data, which tools they use, and where it goes gives analysts context. The map helps them identify routes worth a closer look and form a specific question before opening individual events. They can then examine the records behind that route to understand what happened.
Giving analysts a starting point for investigation.
I designed Bold’s high-level egress map, from its information structure to its interactions and UI. It gave analysts a connected overview to explore before choosing individual events to investigate.
As part of the design team, I defined which sources, data categories, user groups, and destinations appeared, how they were organized, and how selection worked with the event table.
Start with one financial report.
A financial report is created in Google Drive. Someone downloads it to a laptop, edits it, and sends it through Outlook. Another copy is uploaded to Dropbox.
Bold captures the transfers. An analyst can open an event from the table, inspect its details, and follow its flow.
But is this one report’s journey, or a pattern happening across the company?
The table holds the underlying data. Answering that broader question means filtering and comparing many entries. The map brings those connections into one view.
 Incident flow
 Duplicate
Upload attempt
Override
Message in Microsoft Outlook
The source message belongs to alex@example.com. Its sensitive-data marker stays attached as the analyst follows the flow.
- Source
- Microsoft Outlook
- Action
- Inspect message
- Destination
- ACME PC
From one file to the bigger picture.
Start broad, then follow a connection down to the event behind it.
Company
Where is sensitive data going?
Category
Where do financial reports go?
Group
Which teams move those reports?
Route
Through which apps, devices, or channels?
Event
Who sent this report, and when?
The table supports sorting, filtering, and checking exact events. The map makes it easier to explore connections across those dimensions before opening a row.
Original BOLD design: sources, user groups, content categories, and destinations in one connected view. Labels and quantities are sample design data.
Separate rankings don’t show a connected route.
The table could show the most active source, the most common data category, and the top destination. But those rankings didn’t prove that the same data moved between them. Analysts needed to select a source and see only the categories, teams, and destinations connected to it.
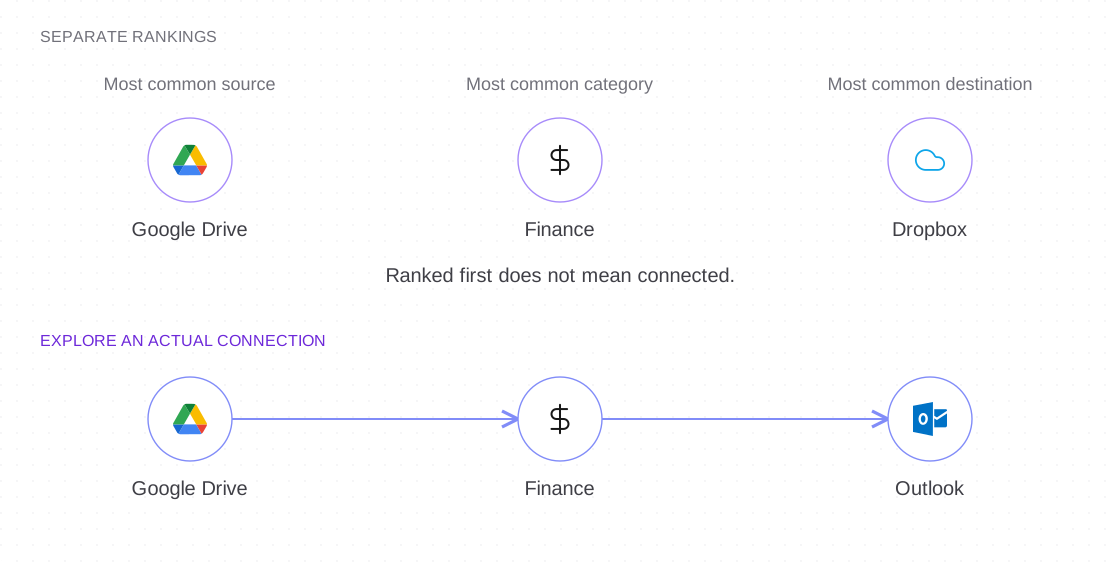
Illustrative comparison using original BOLD components.
Choose a starting point. Follow the connections.
Hover previews a connection; selection keeps it in focus. Expanding a node reveals related sources, while filter chips show the chosen scope.
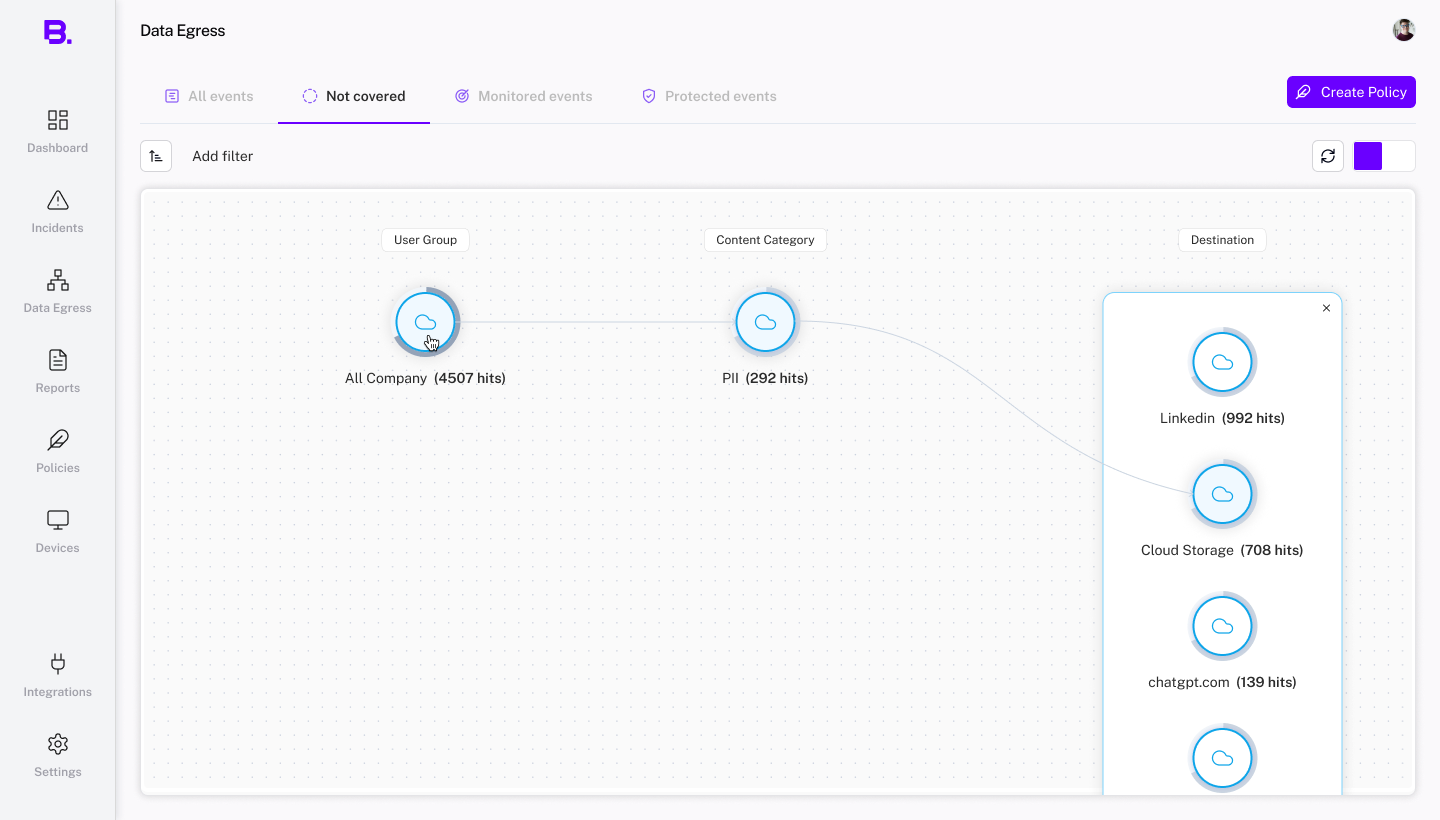
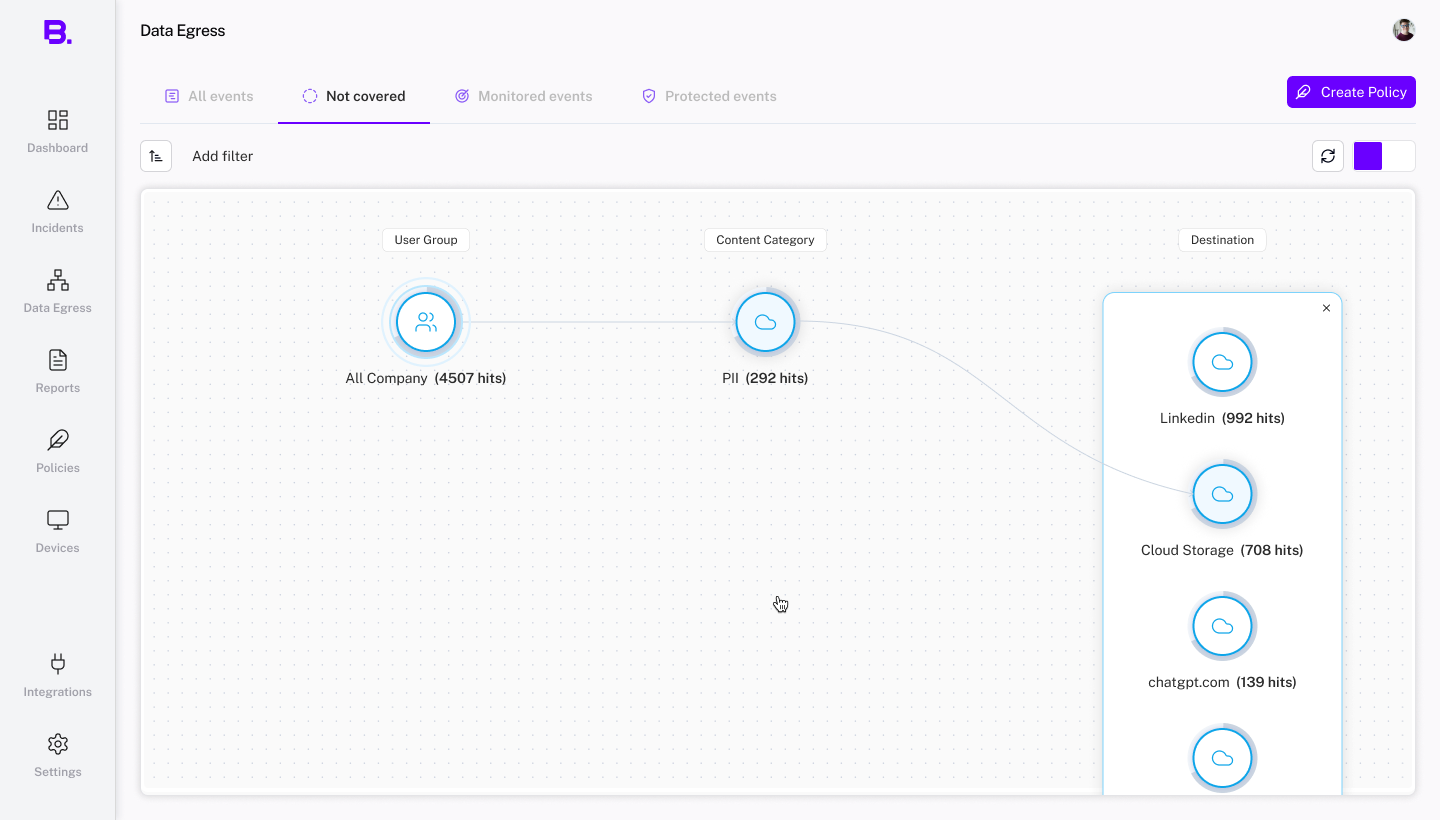
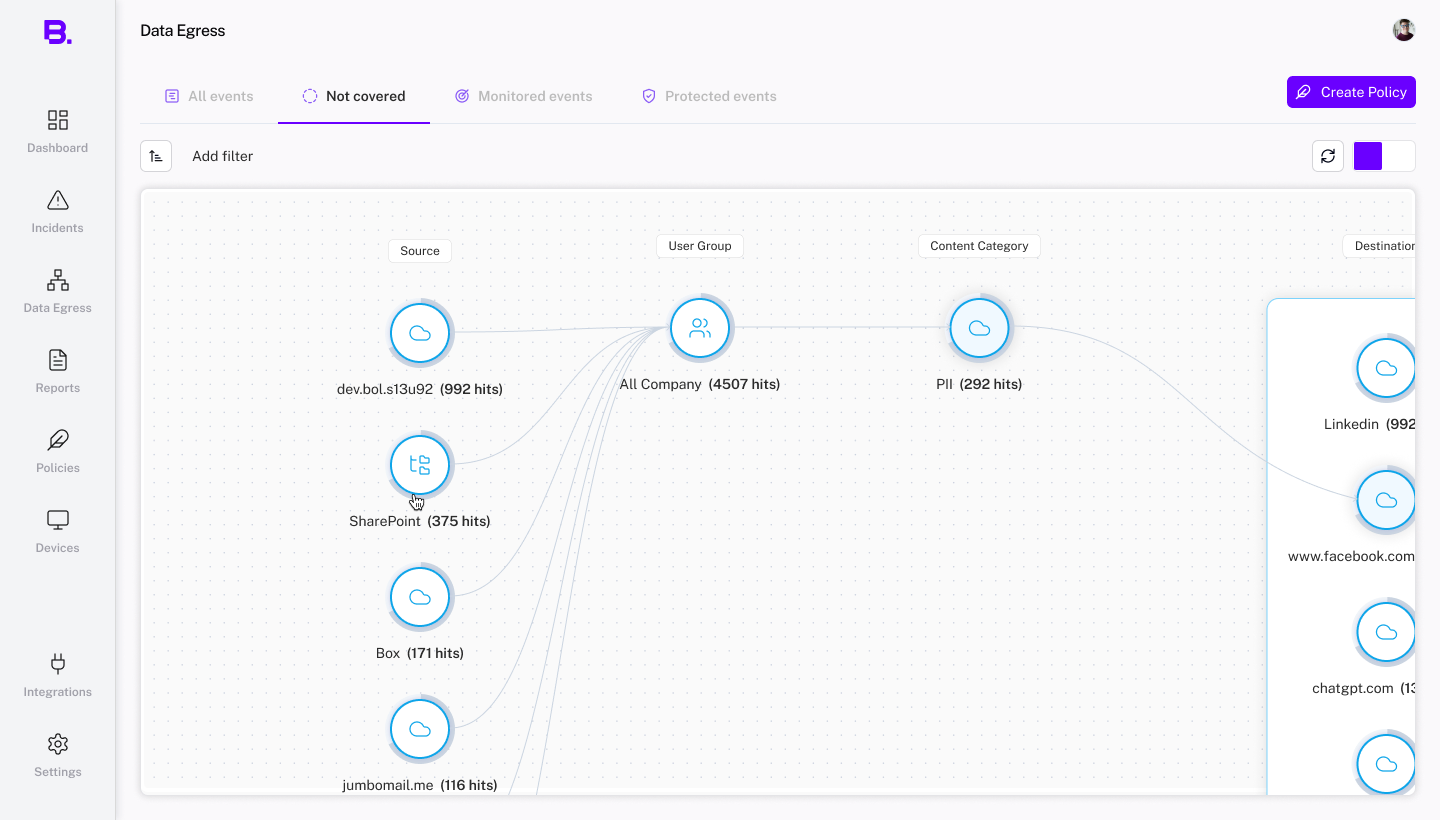
Original Figma interaction states. Sample data varies between design variants.
From the route to the event.
The map helps analysts choose what to investigate. The table provides event-level facts, and opening a row reveals the individual flow.
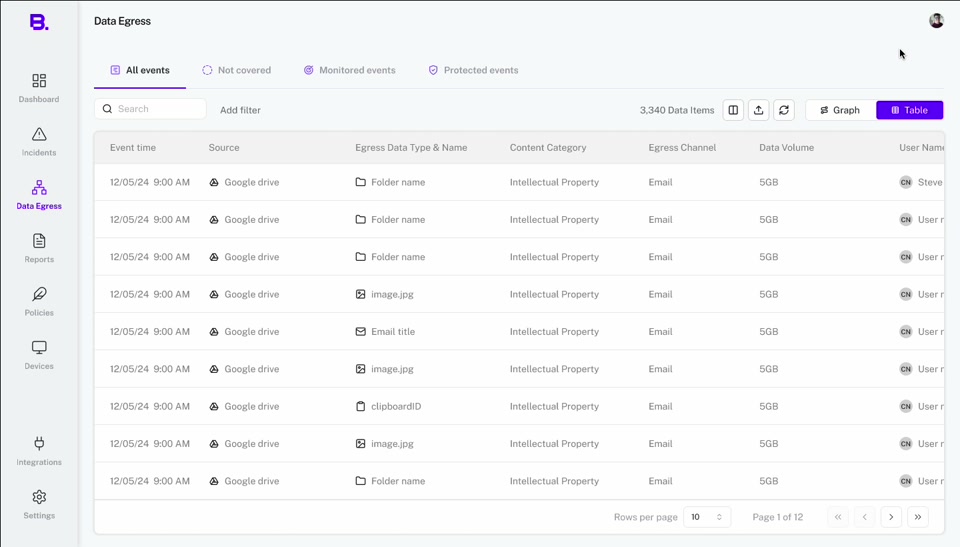
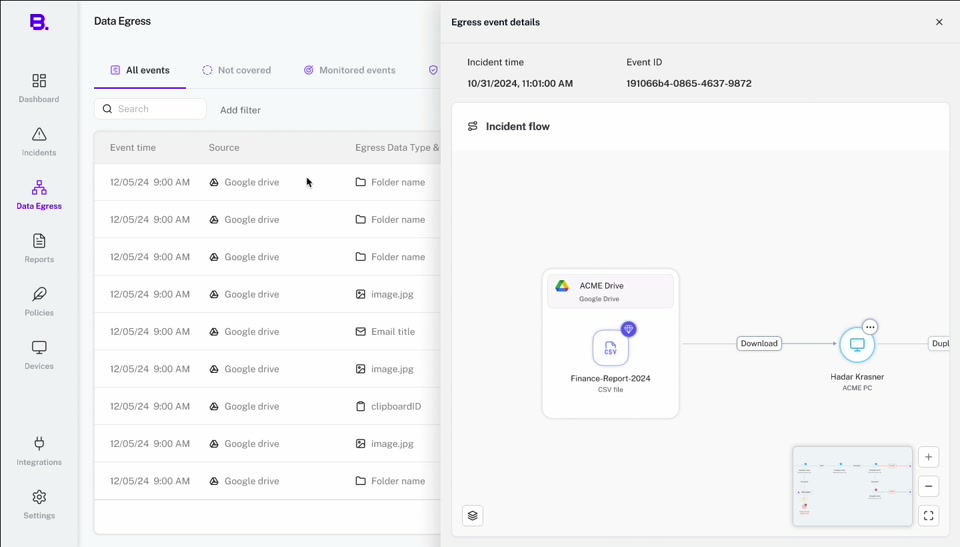
Original table and event-detail screens. These use different sample data from the map above.
Redesigning the map around KeyLines.
My first proposal connected five columns with quantity bars. It aimed to help analysts compare volume while following data from source to destination.
Engineering had selected KeyLines and asked for an alternative using the nodes and curves already used in Incident Flow. I led the redesign around grouped nodes, numeric counts, and route selection.
The trade-off I had to resolve
Bars made differences in volume easier to scan. Reusing graph components offered a more consistent implementation, but the quantities now required reading individual numbers.
- What changed
Quantity bars became numeric counts beside reusable nodes.
The column proposal
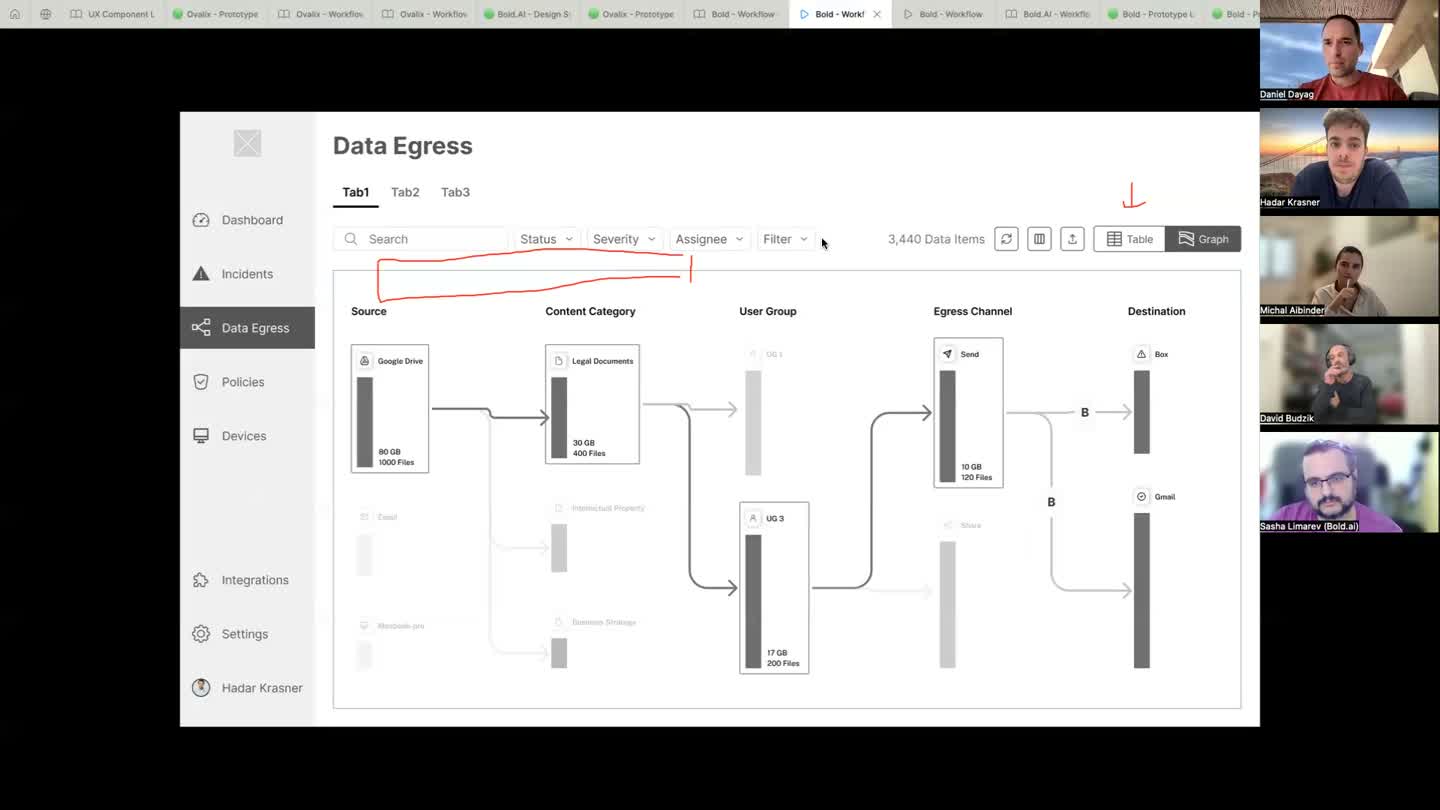
Recorded design review · 29 October 2024, 08:03. Sources, categories, groups, channels, and destinations use bars to show quantity. Grouped graph components
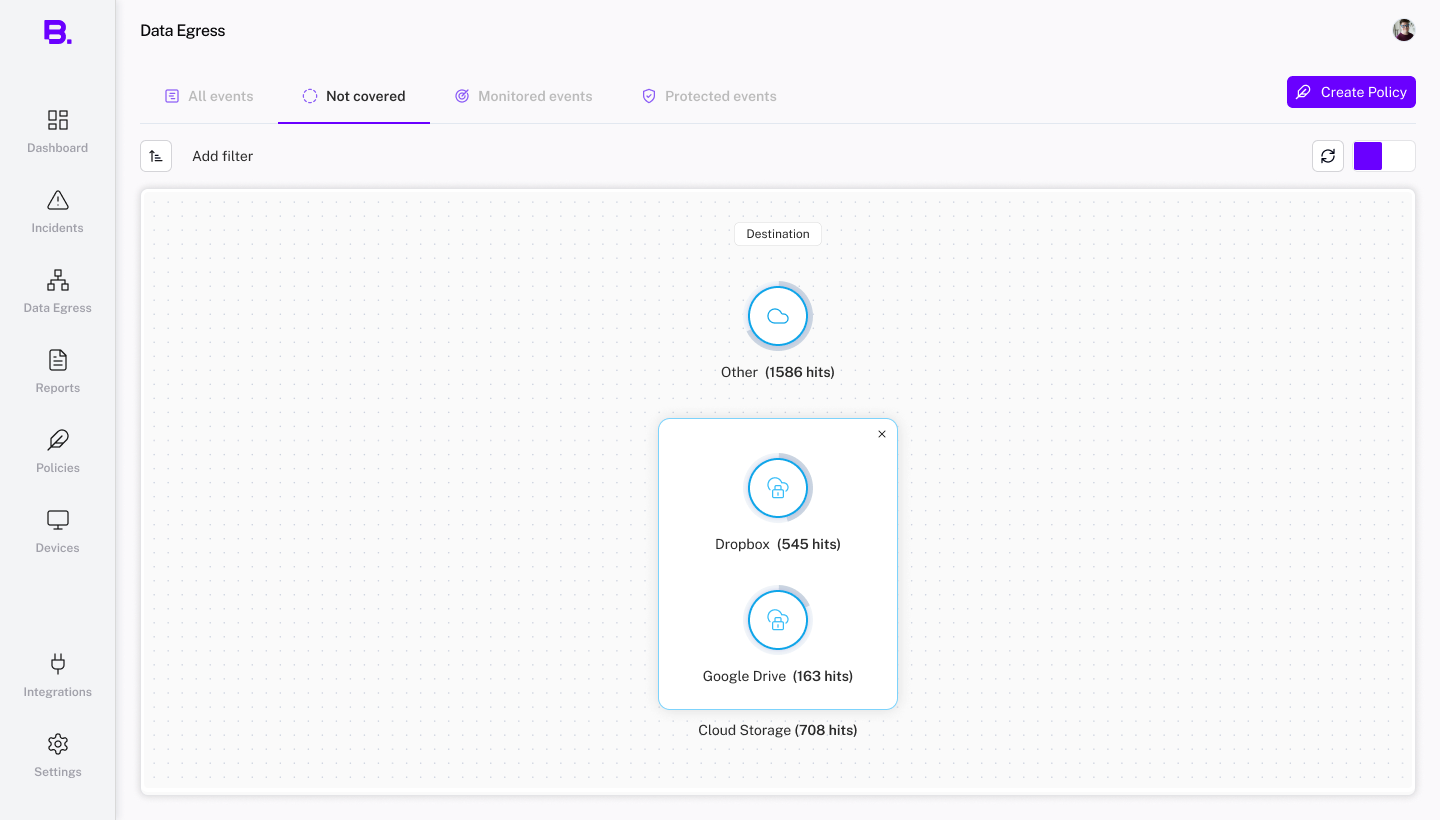
Original design state · Cloud Storage expands into individual destinations with numeric counts. - Preserved
- Sources, groups, content, and destinations stayed connected in one investigation model.
- Bounded
- We discussed limiting column reordering to reduce development cost and edge cases.
Design reviews, 29 October and 3 November 2024, document the component-reuse request and the bars-versus-numbers trade-off. The screens show design directions rather than a verified production comparison.
What I delivered.
I defined the map’s information structure and designed its UX, interactions, and UI: a connected overview, a way to focus on a route, and shared filters that carried that focus into the table.
- 1
Organize the investigation
Separate sources, people, content, and destinations into readable columns.
- 2
Keep the selected route visible
Highlight connected nodes and fade unrelated paths so the analyst can follow the relationship.
- 3
Make the focus explicit
Show active selections as filters above the map, with a table view available for checking events.
Internal reviews supported making selections visible through filters. They also identified clarity and implementation questions for prototyping and design-partner feedback.
Looking back, I’d check the graph library’s limits earlier and test the opening view before refining more interactions: can an analyst choose a useful starting point and explain why it matters?